Information Design
Web Design
UX/UI
Are you sure you want to see this?
Part 1 | Data exploration and visualization on the distribution of the ISIS videos online.
In the 2016/2017 edition of the Final Synthesis Studio at Density Design Lab we were asked to use information visualization, both as an analytical and a communicative tool, to observe, understand, shape and communicate complex phenomena.
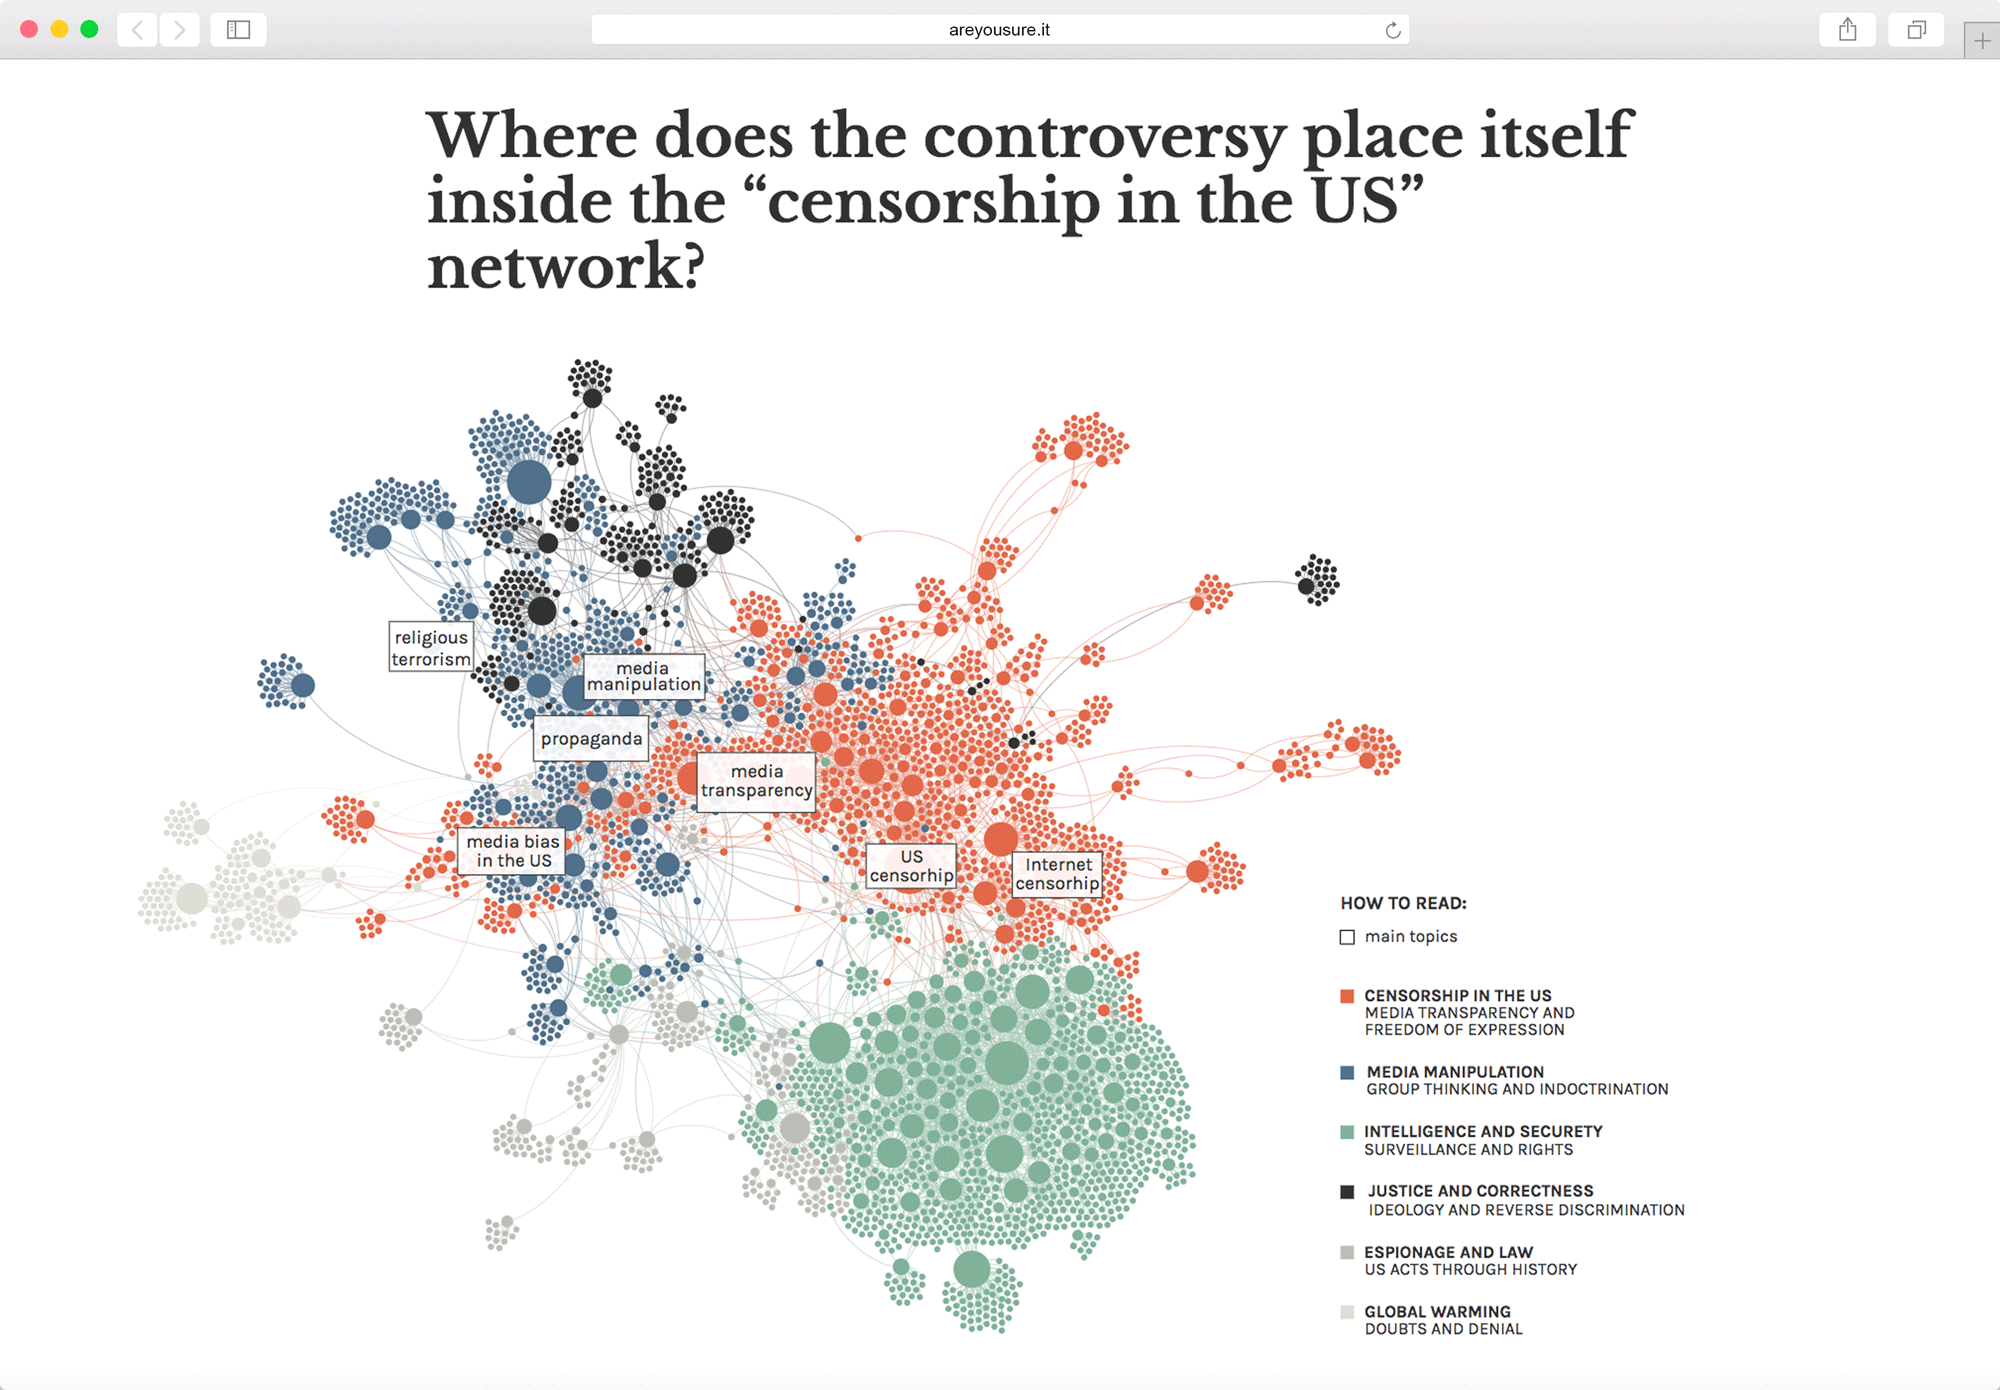
In the second part -explore part one- of the course, we have to select a specific controversy and depicted its current develpment, highlighting the debate related to the issue. Our goal was to identified the actors relevant to the topic and mapped their positions and connections. Taking cue from the "Digital Methods", we had to harvest data directly from the web, picking the sources they deemed more appropriate in relation to the debate but also developing new solutions to collect, analyze and represent the data. The result is a "visual atlas" aimed at reporting the debate, representing the actors that take part in it and their stances.
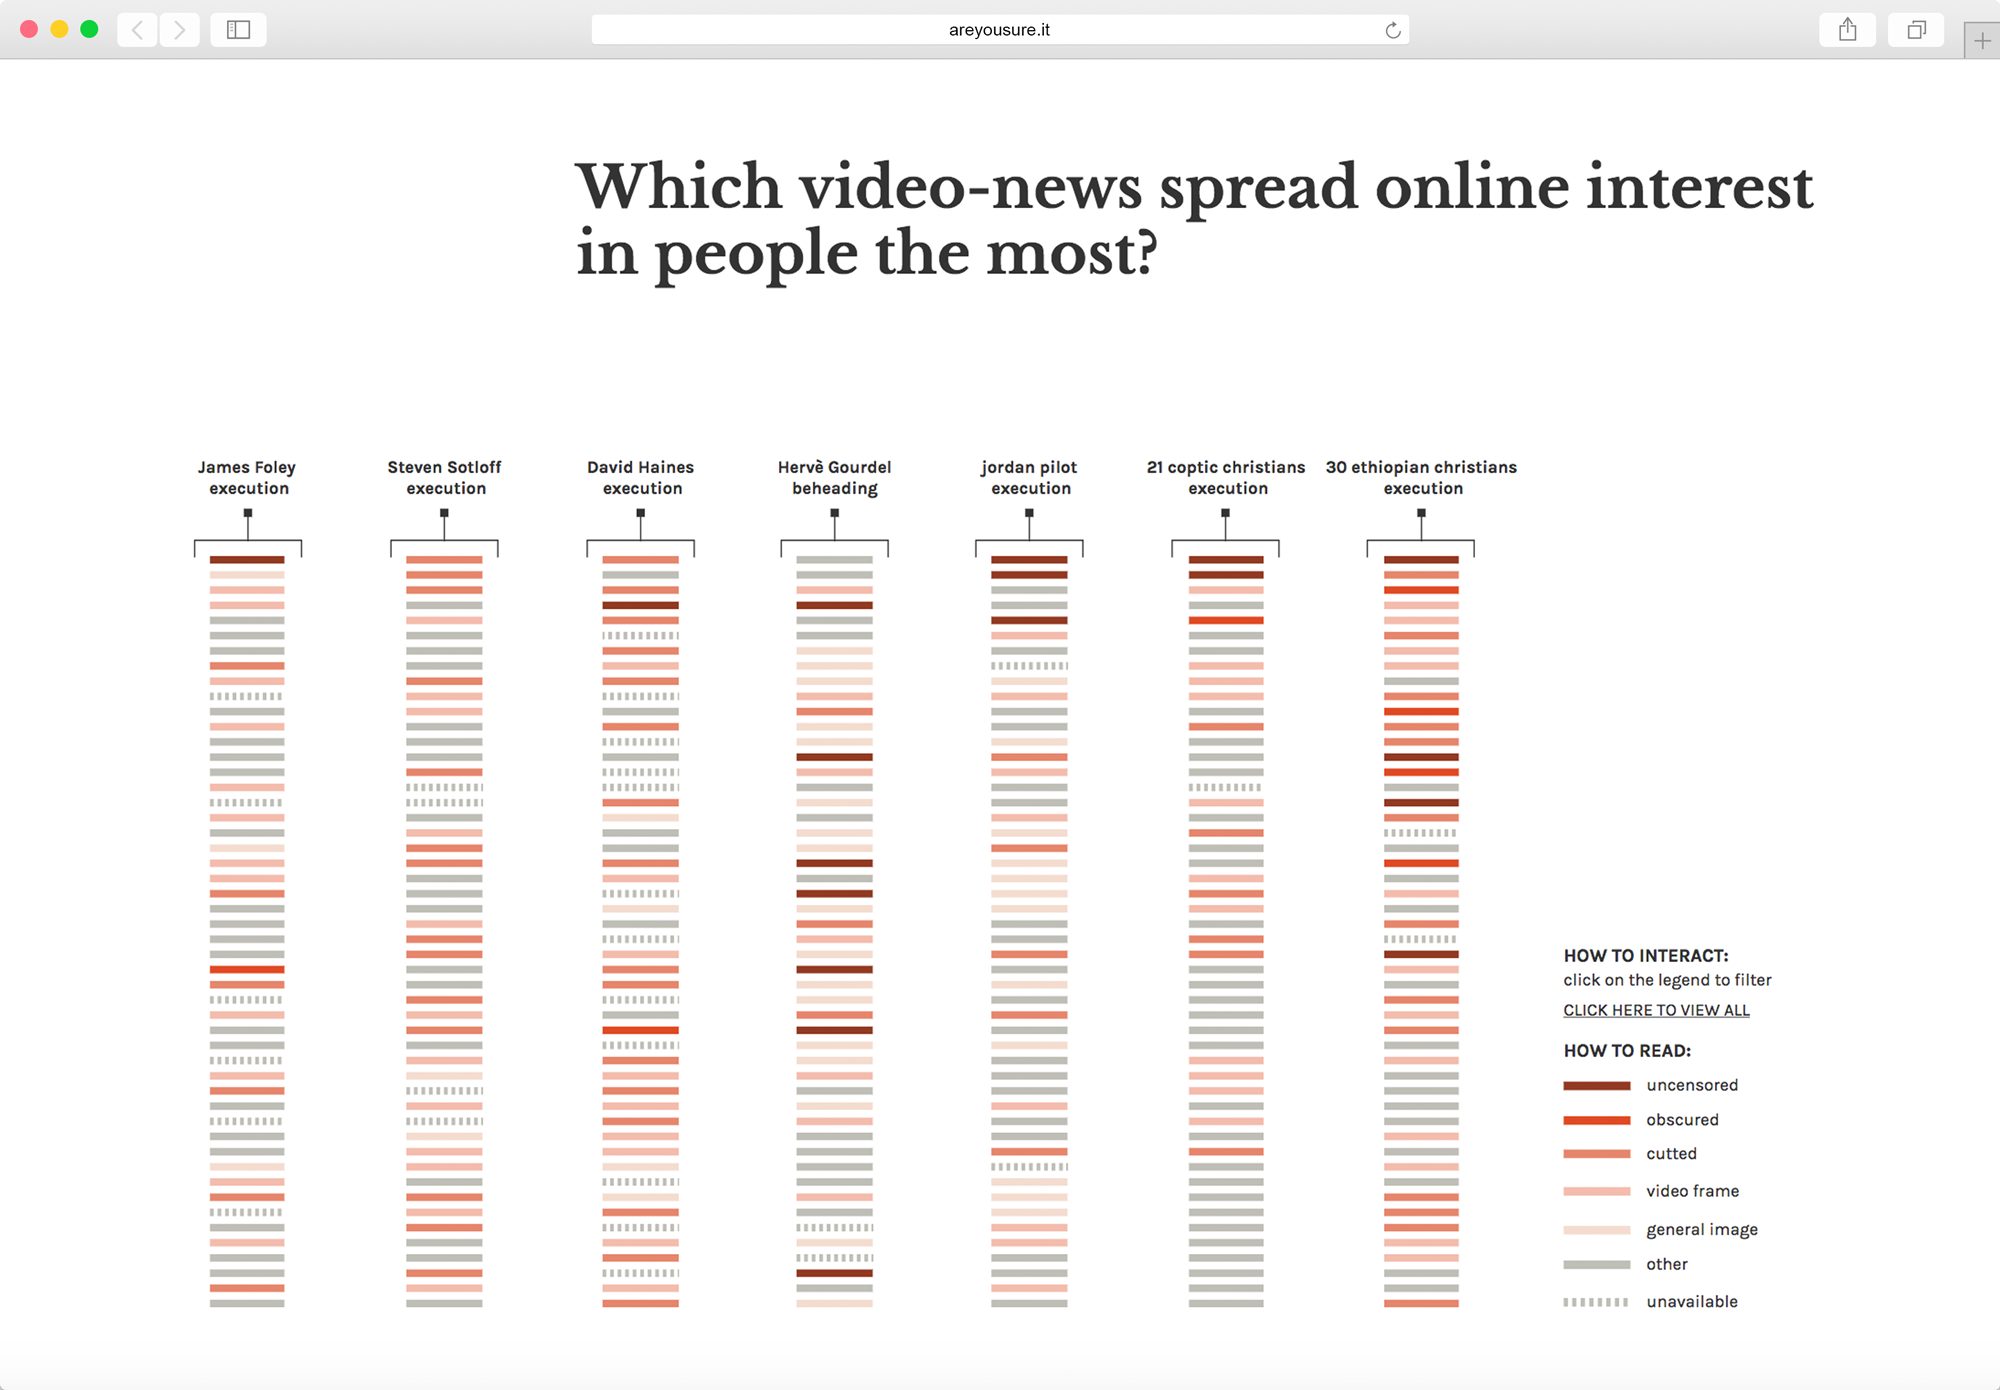
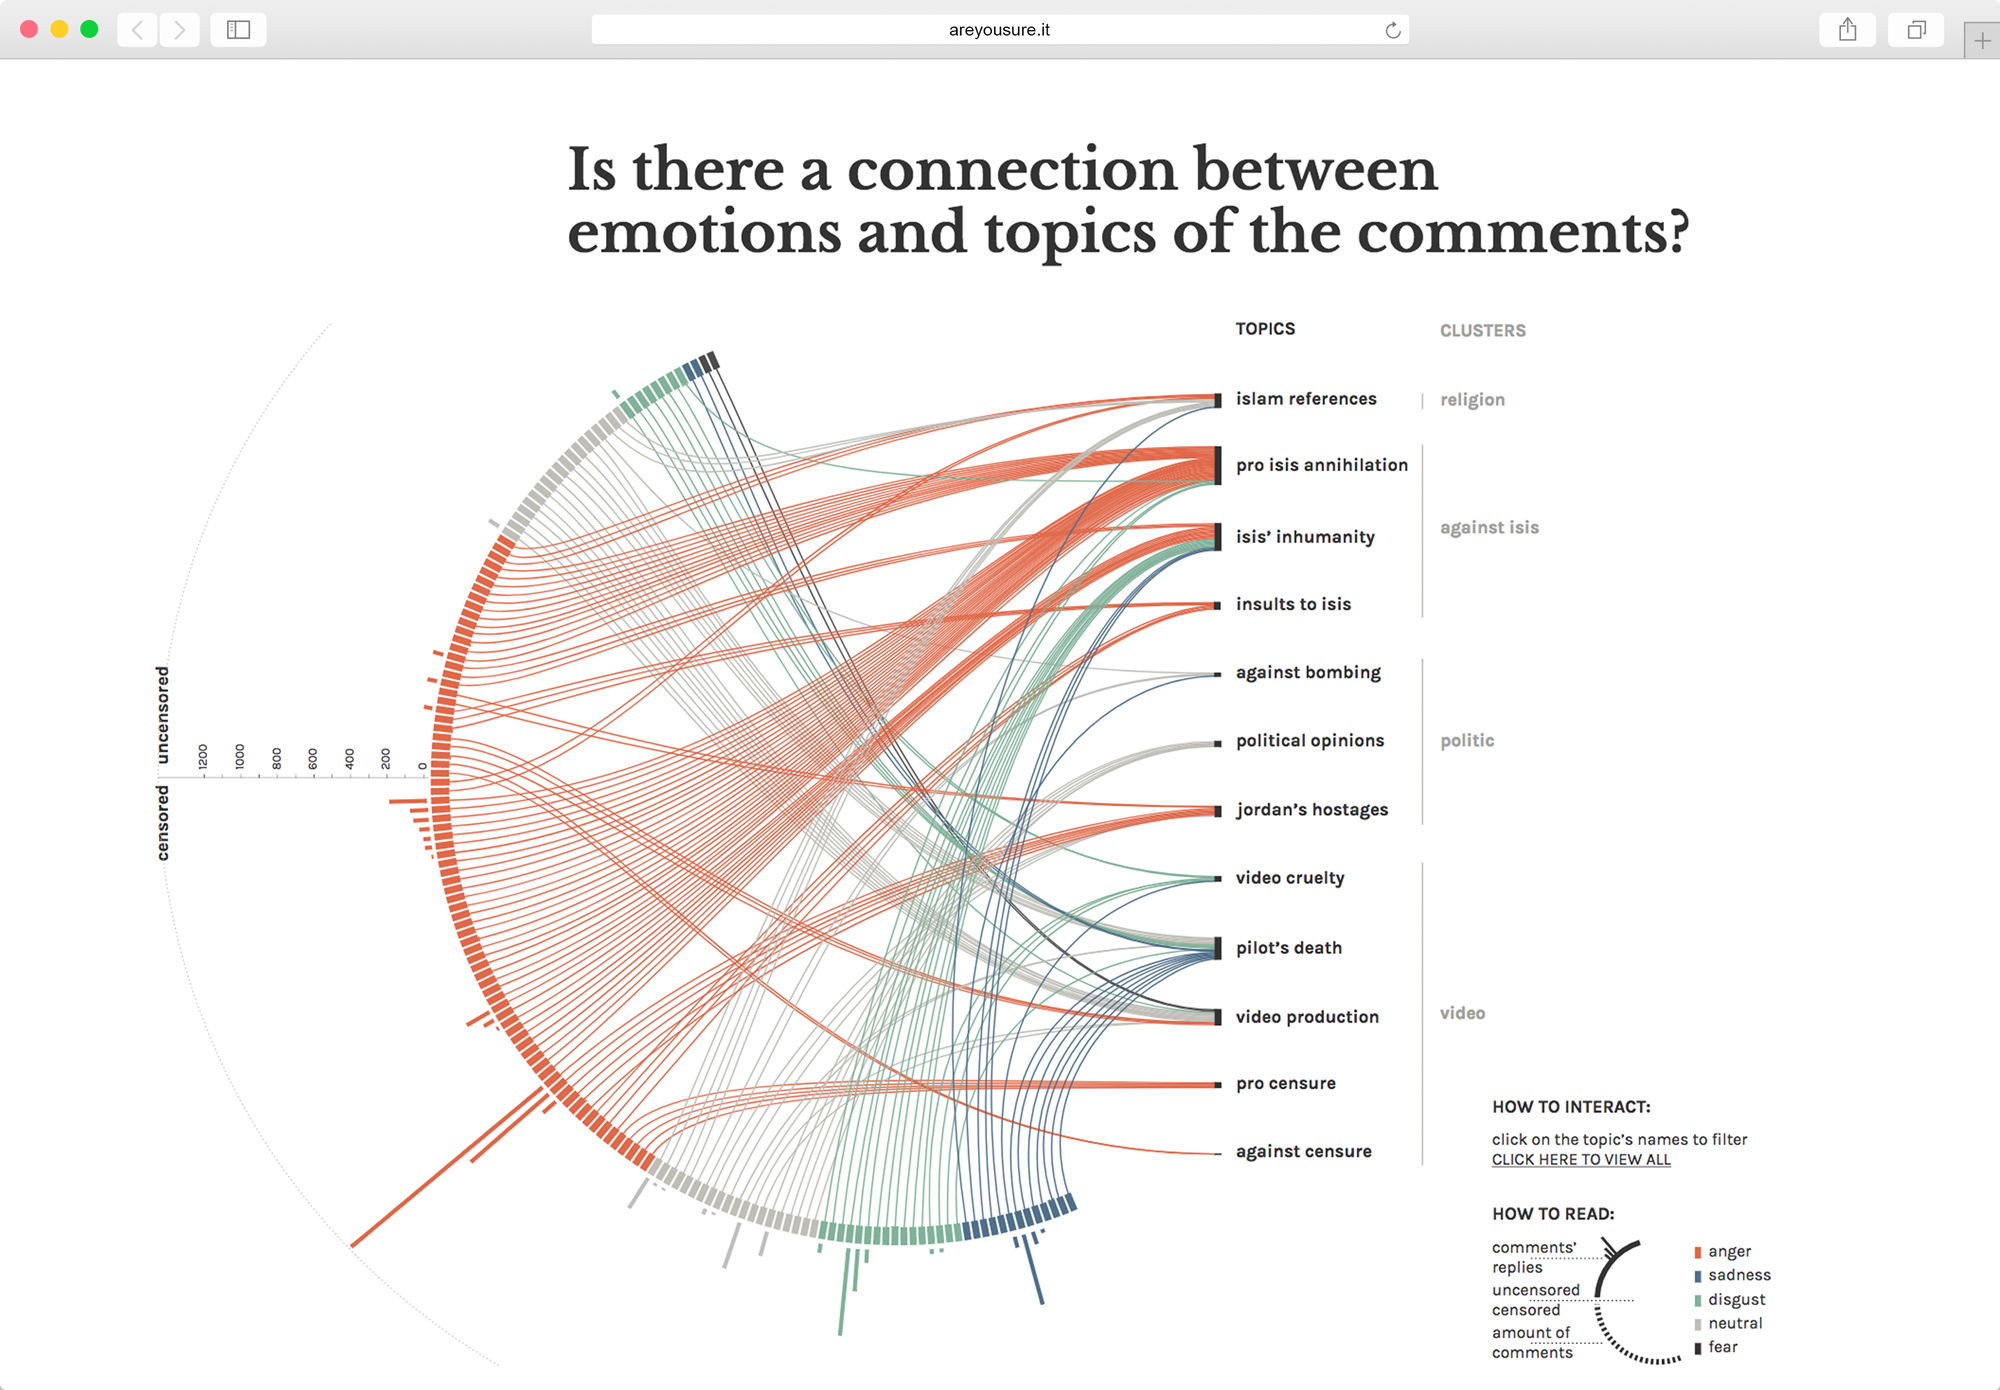
When terrorism appears as the headline news, what do people search online? The project focuses on the video-executions produced by ISIS, which can be considered as news themselves. Starting from the events that cause debate, we analysed the way several platforms deal with content and the way users respond to this kind of information. How can the way an event is presented and spread online affect the perception of the phenomenon itself?