Data Experience
Information Design
UX/UI
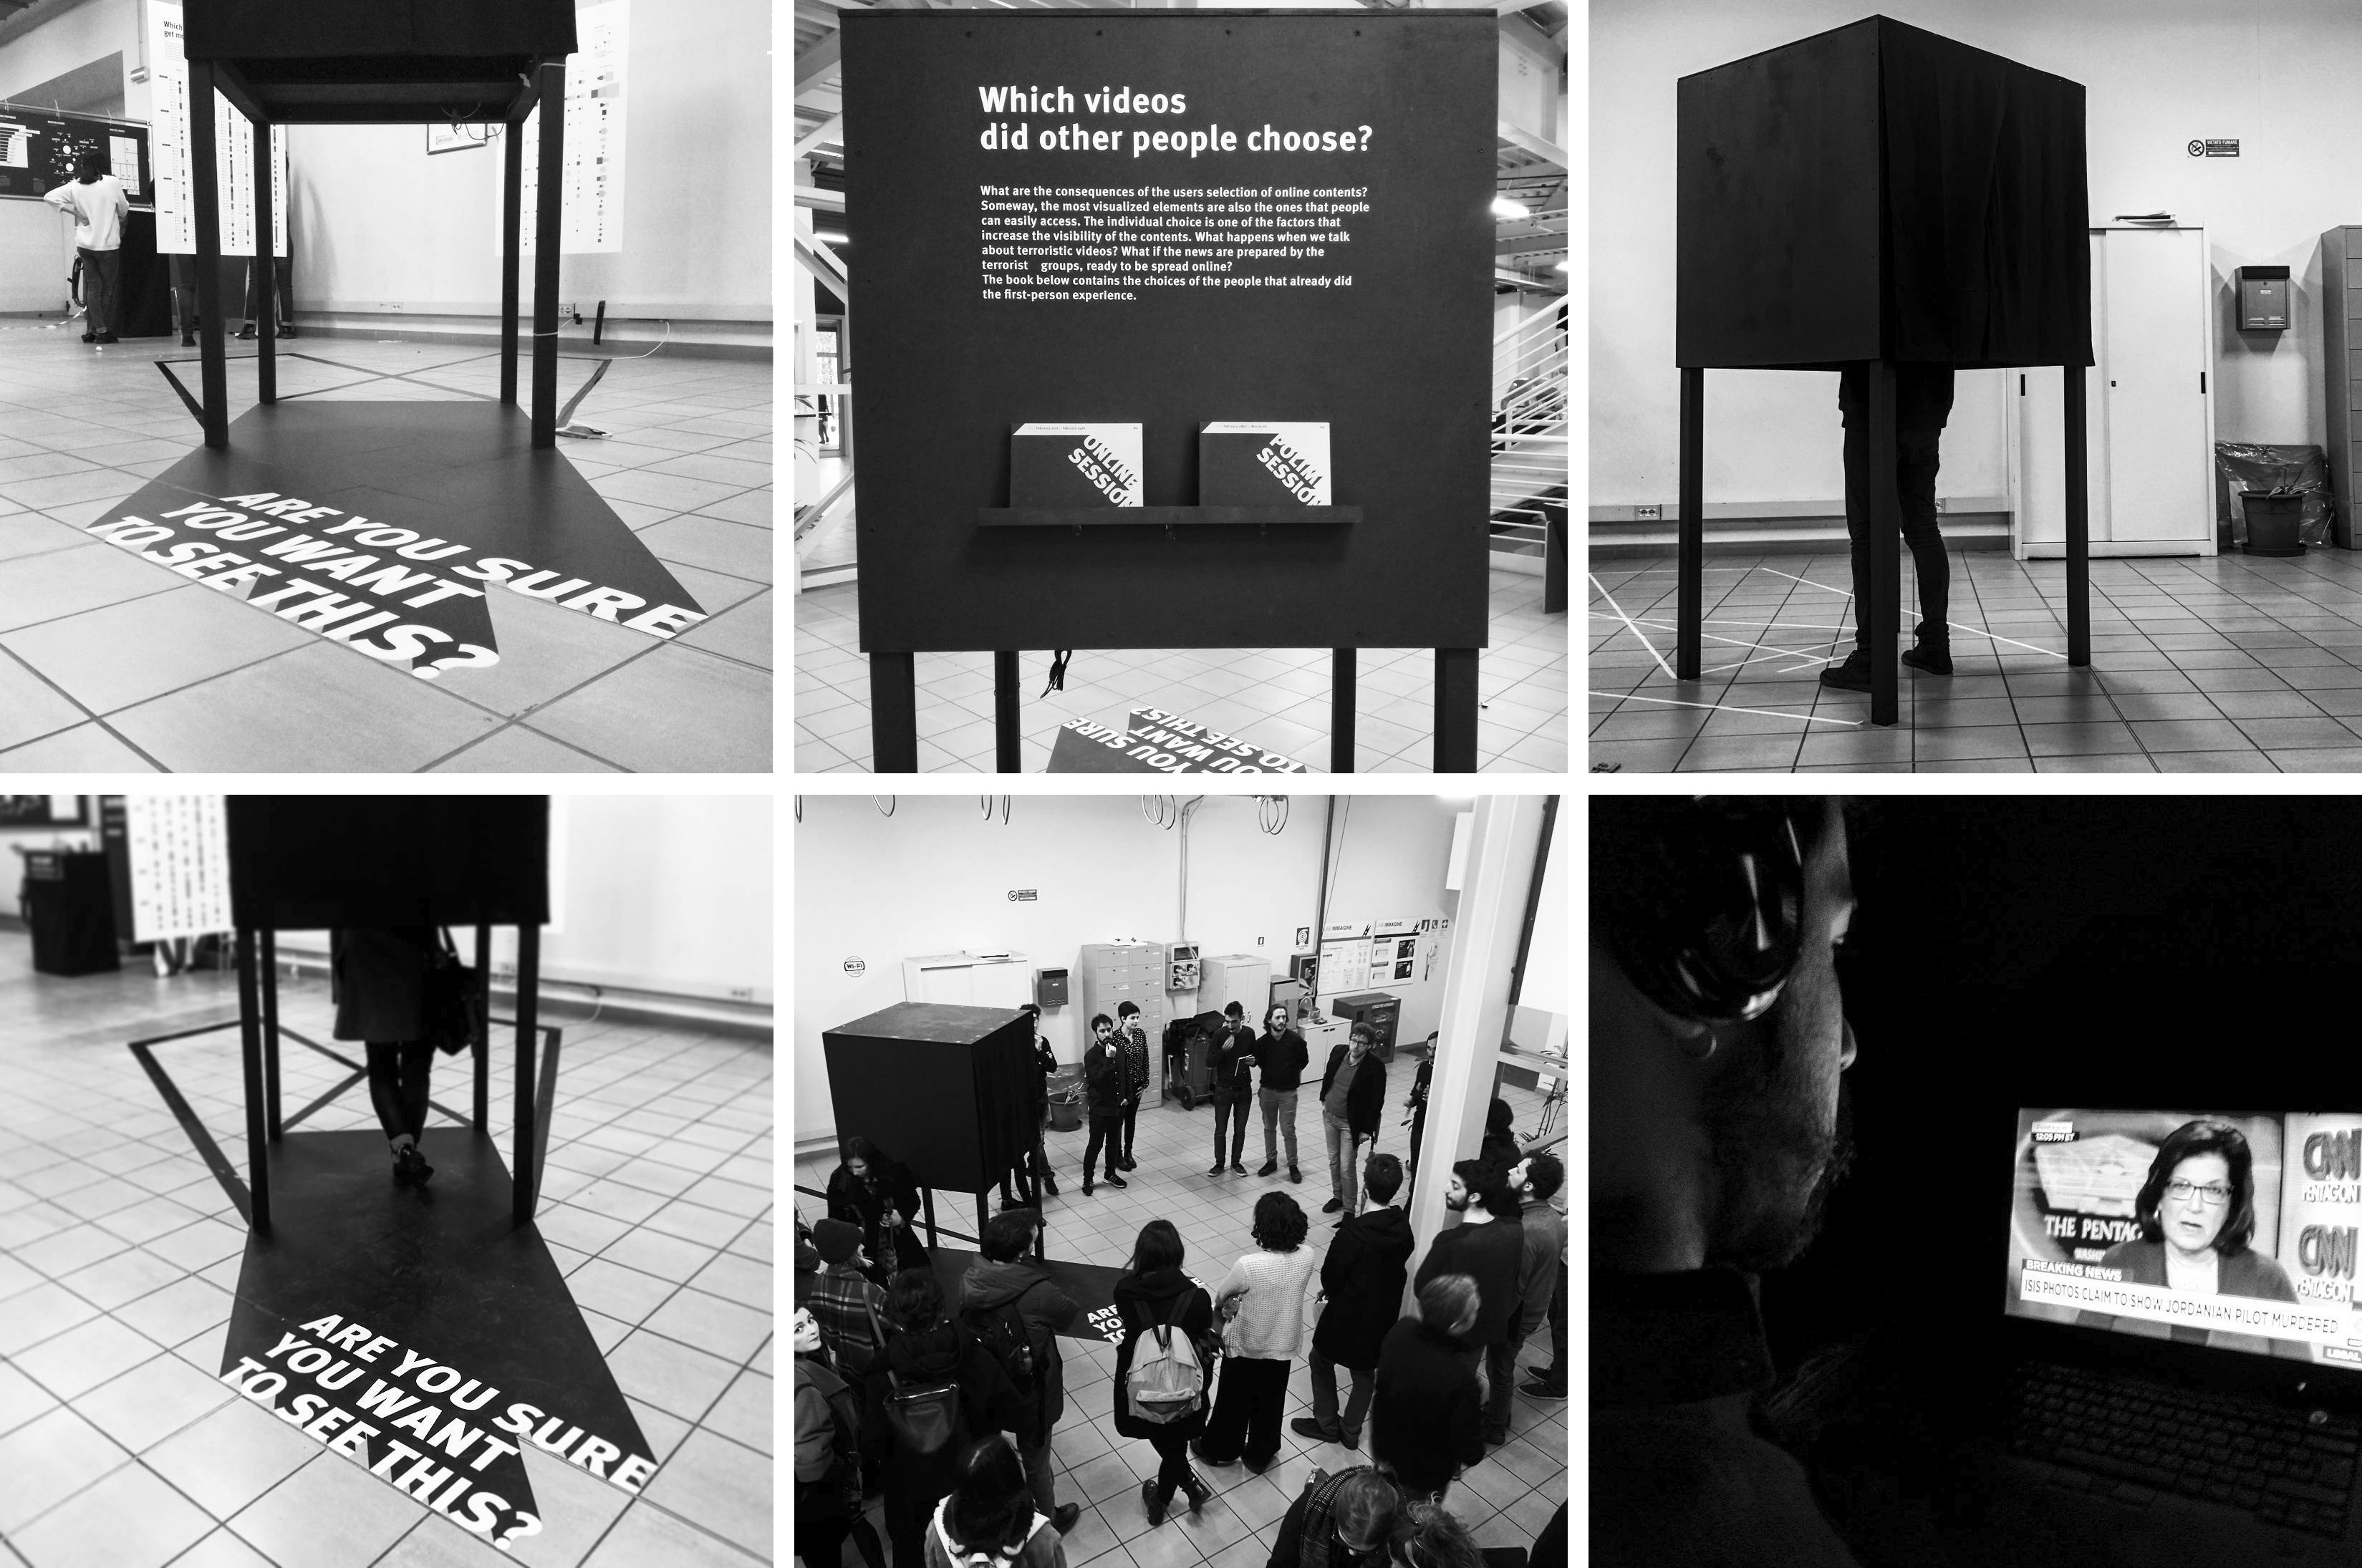
Are you sure you want to see this?
Part 2 | A Data Experience about the distribution of the ISIS videos online.
In the 2016/2017 edition of the Final Synthesis Studio at Density Design Lab we were asked to use information visualization, both as an analytical and a communicative tool, to observe, understand, shape and communicate complex phenomena.
In the third part - explore part one & part two- of the course, we selected a specific point of view from the controversy we have been analysing throughout the course. We used visualizations as a tool for advocacy, representing through data a particular facet of the issue but trying at the same time to mantain coherence and accuracy. The final output was a collective exhibition made of interactive and physical artifacts, documented here in the form of websites.
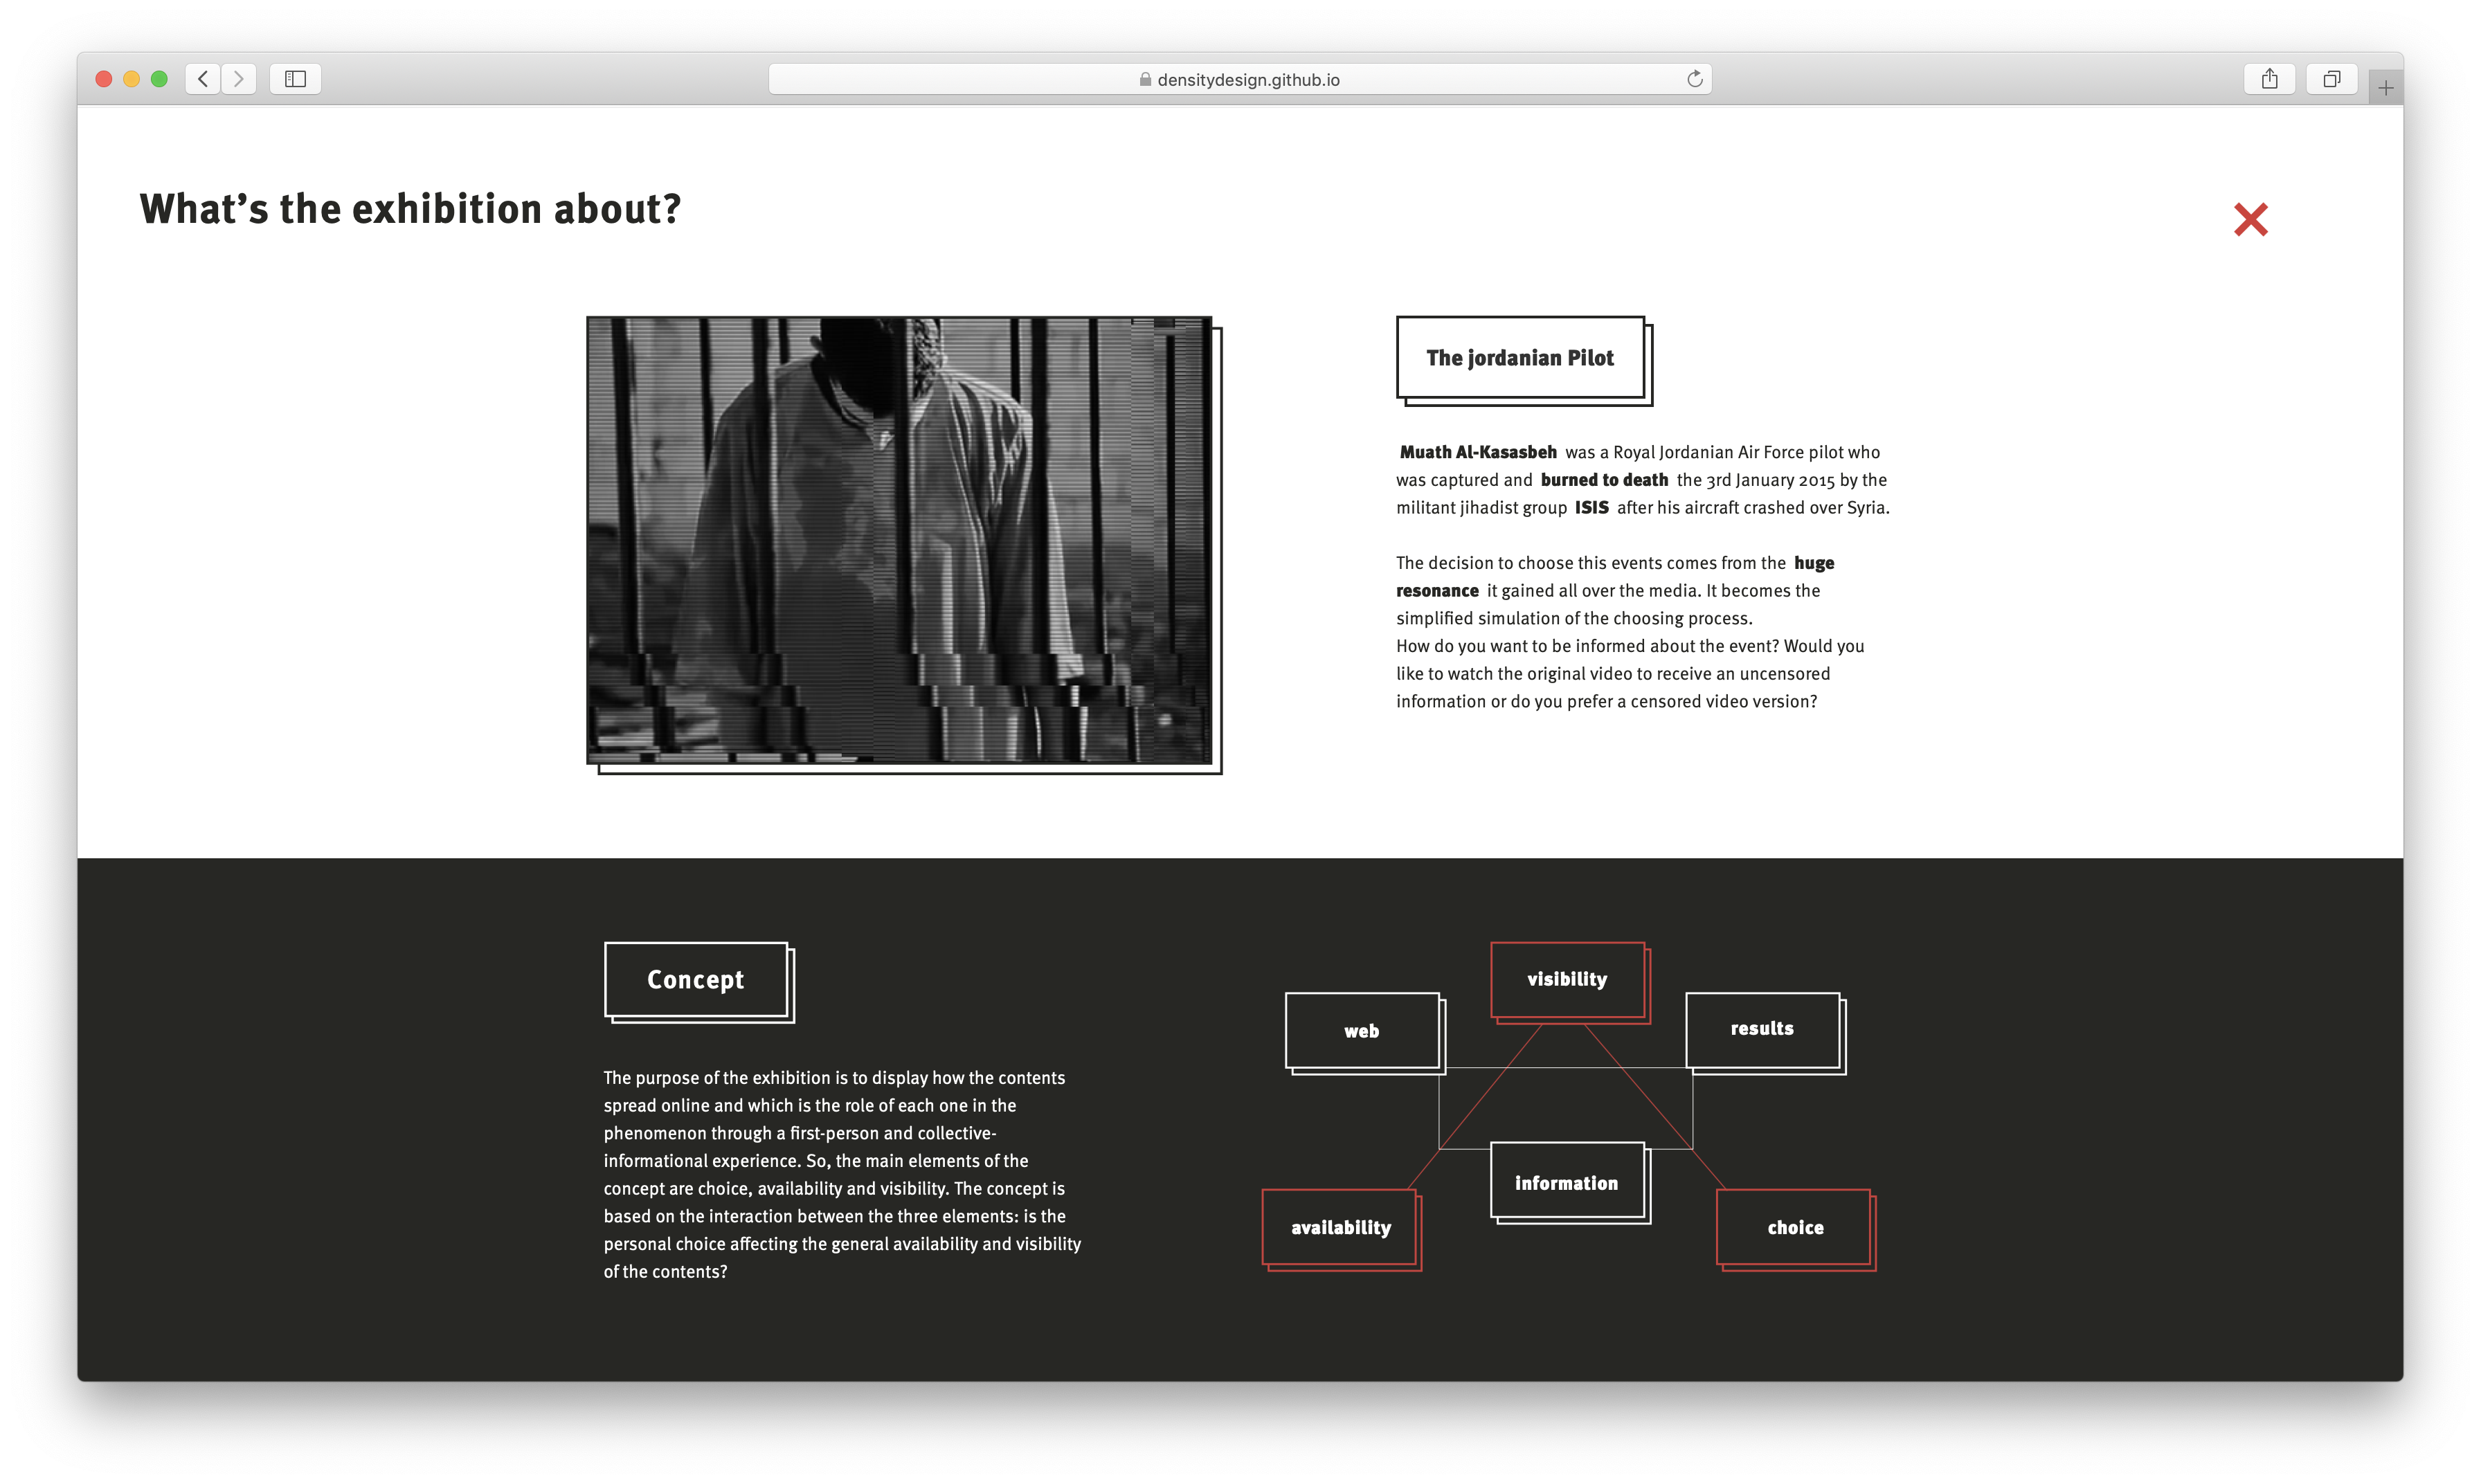
Muath Al-Kasasbeh was a Royal Jordanian Air Force pilot who was captured and burned to death the 3rd January 2015 by the militant jihadist group ISIS after his aircraft crashed over Syria.The decision to choose this events comes from the huge resonance it gained all over the media. It becomes the simplified simulation of the choosing process.
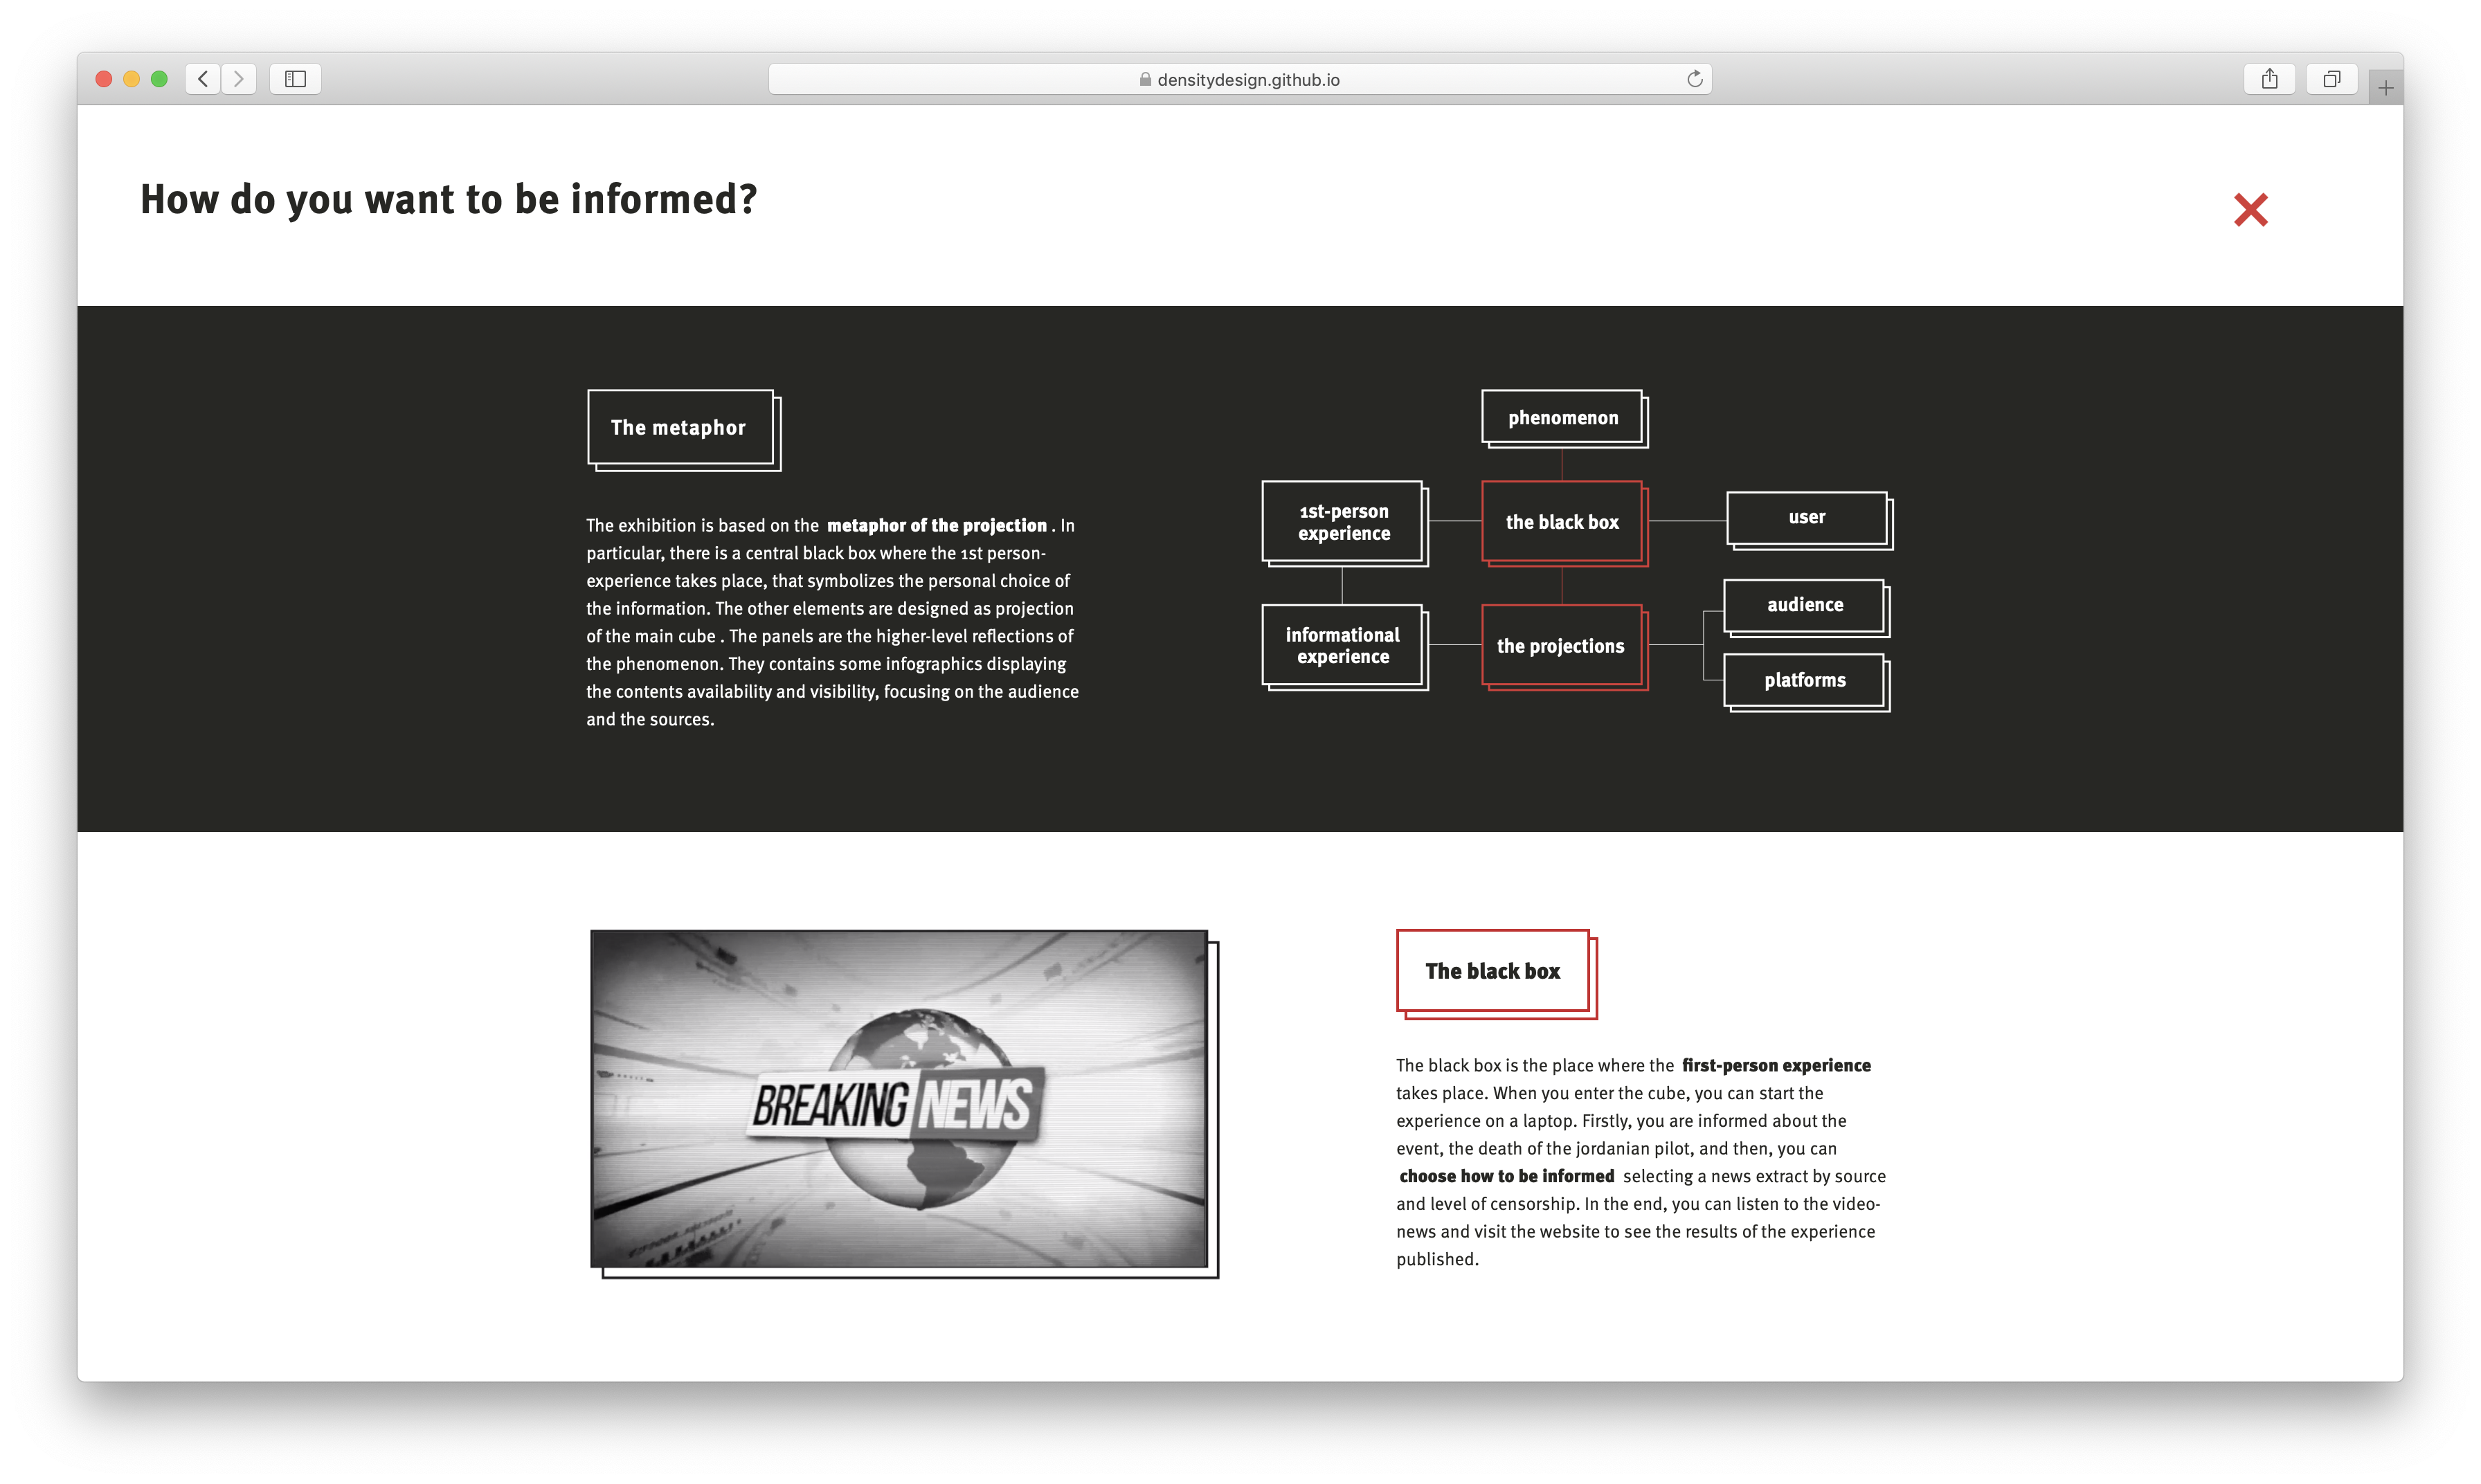
The black box is the place where the first-person experience takes place. When you enter the cube, you can start the experience on a laptop. Firstly, you are informed about the event, the death of the jordanian pilot, and then, you can choose how to be informed selecting a news extract by source and level of censorship.
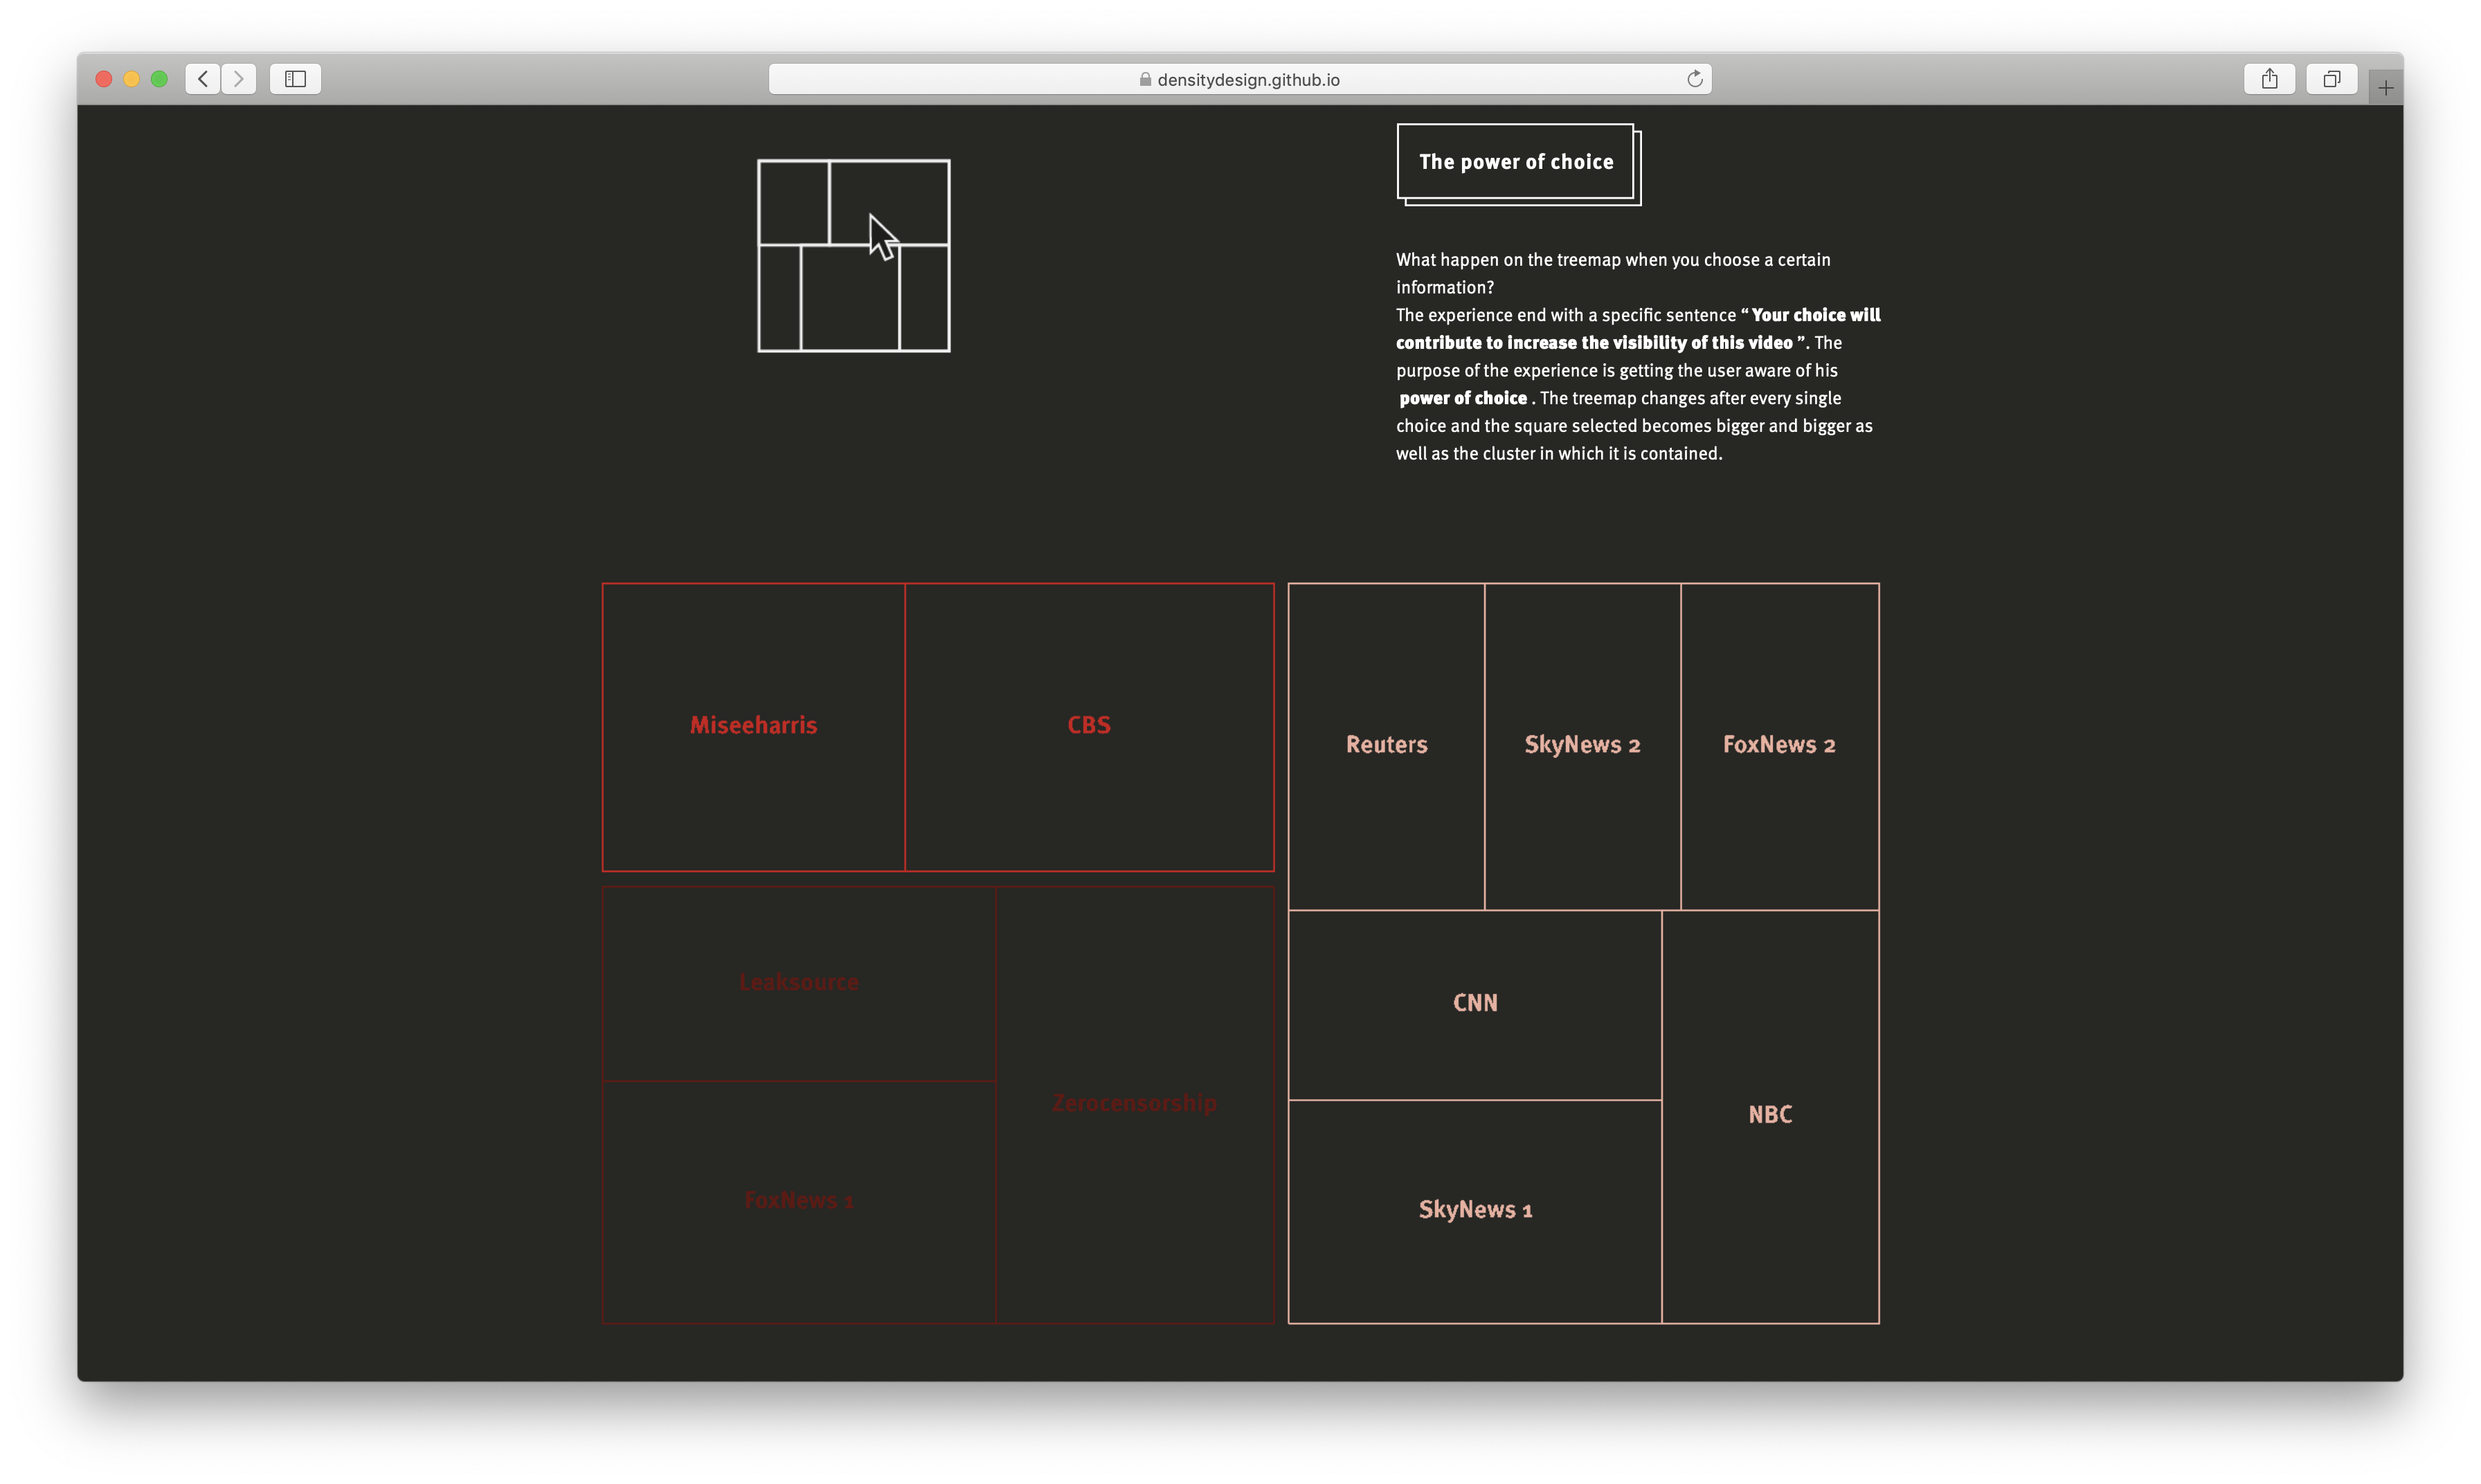
The experience end with a specific sentence “Your choice will contribute to increase the visibility of this video”. The purpose of the experience is getting the user aware of his power of choice. The treemap changes after every single choice and the square selected becomes bigger and bigger as well as the cluster in which it is contained.